
Transactions, Purchases & Refunds Graph
The transaction purchases and refunds graph is an interactive visualisation that provides a high-level pulse check on your business health, from daily sales volume to long-term growth trends. By plotting purchases and refunds side by side, this graph allows you to quickly assess the net performance of your transactions and identify patterns that may require attention.
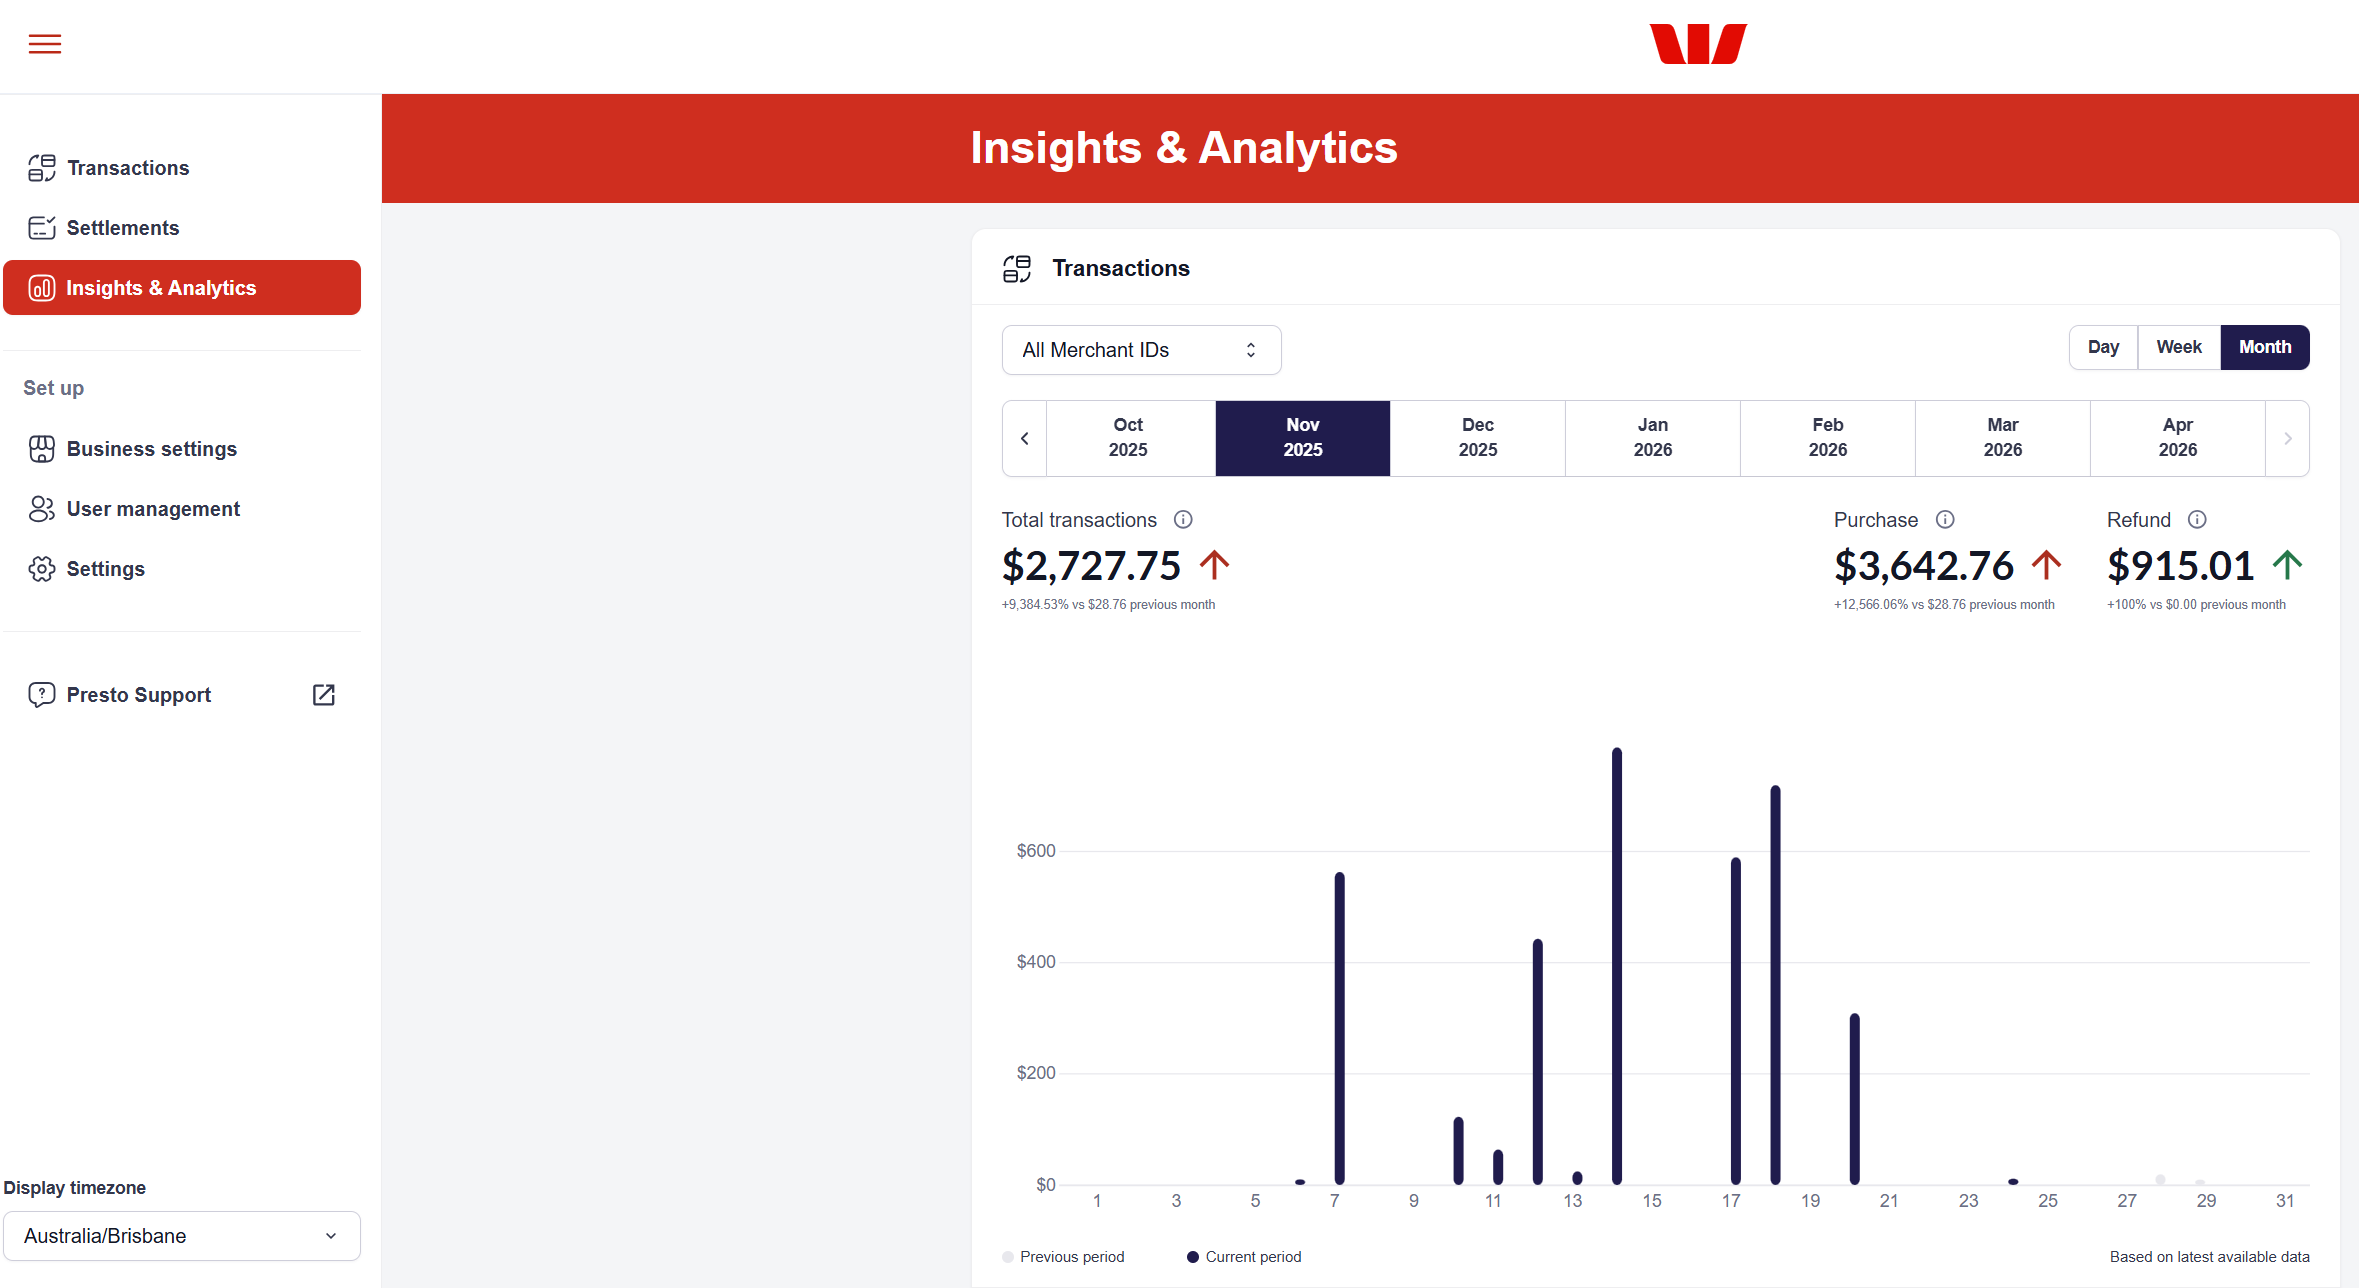
The Transactions, Purchases, and Refunds graph is the first graph shown in the Insights and Analytics section of your dashboard.
To view the graph, navigate to the Insights and Analytics page from the vertical navigation menu on the left. By default, the graph will display data for All Merchant IDs for Today.
Key Performance Visuals
At the top of your dashboard, you will find calculated summaries for your selected time period. These metrics provide a snapshot of your business performance:
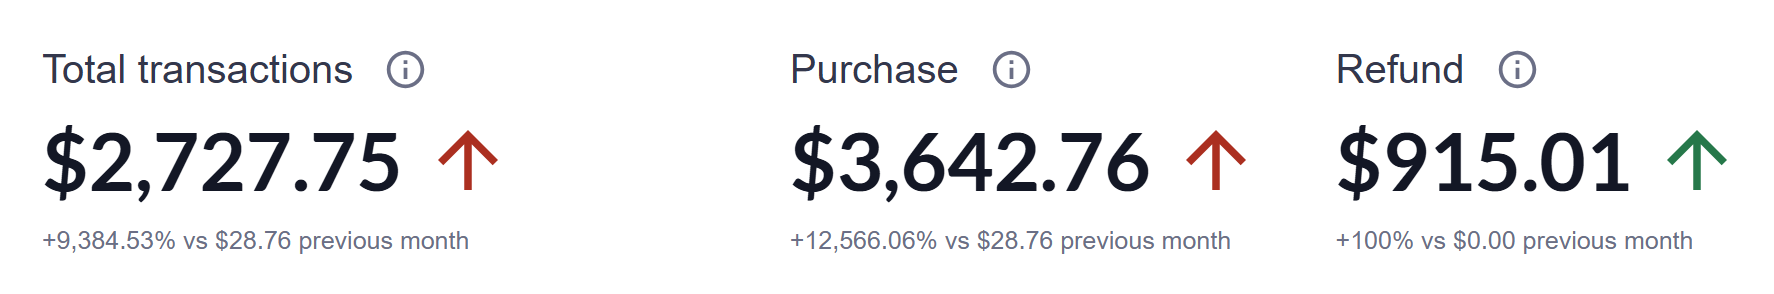
Total transactions
The aggregated view of purchases minus refunds for that time period.
Purchases
The total gross sales volume.
Refunds
The total value of reversed transactions, plotted against purchases to show net health.
The Comparison Column Graph
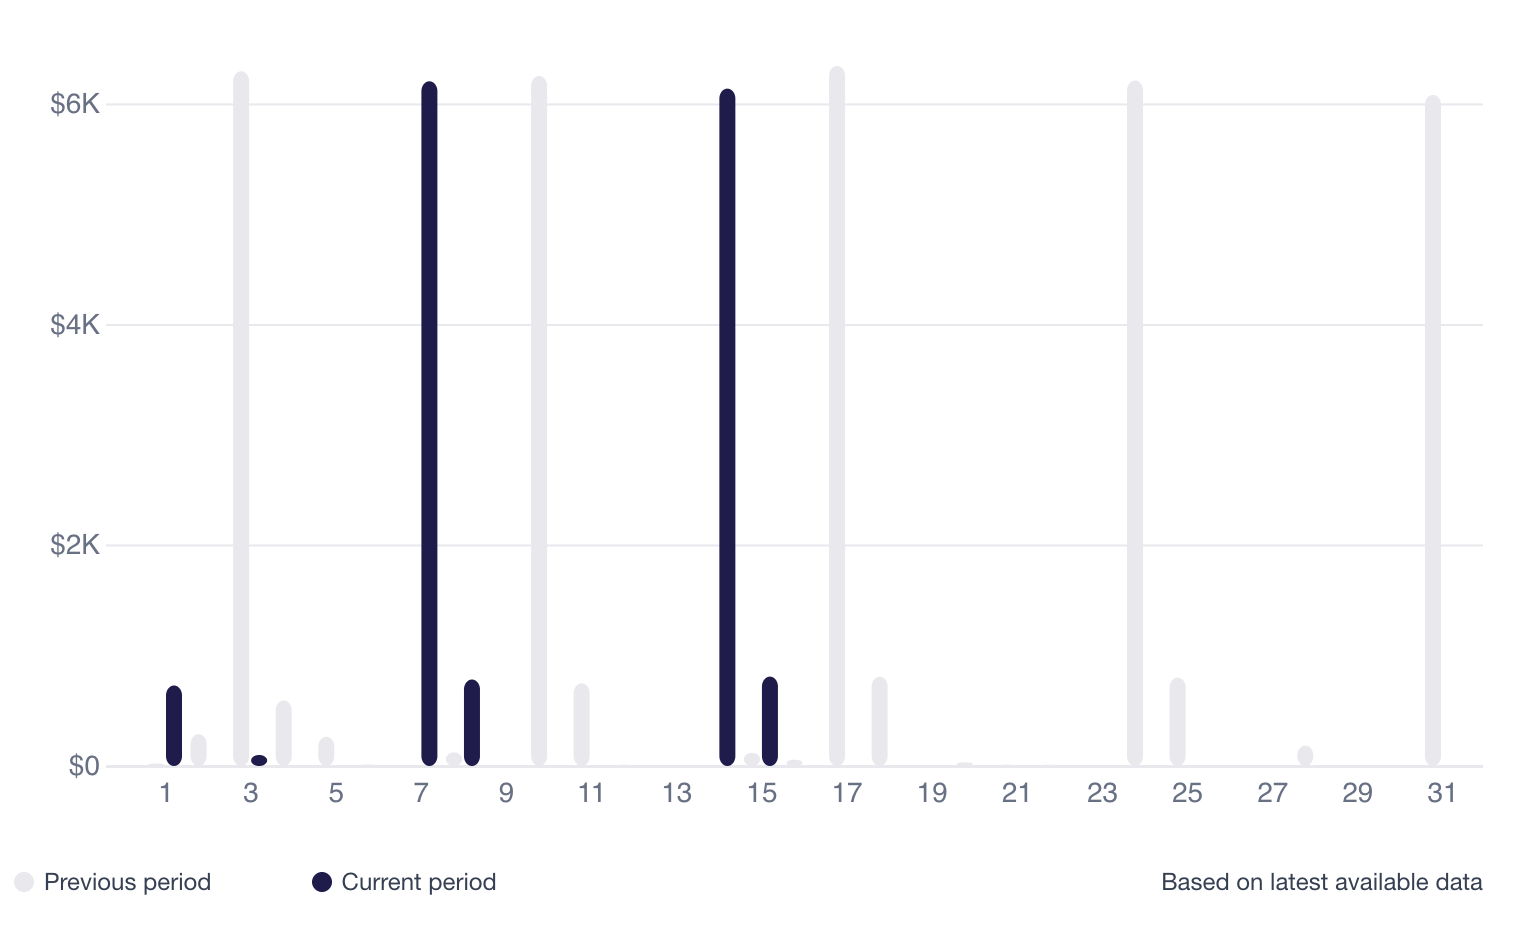
This bar-style visualisation directly compares your Current Period performance against the Previous Period. It shows the total aggregated transactions, or purchases minus refunds.
The graph provides a clear visual of how your business is performing in the current period compared to the previous one. If the current period bar is taller than the previous period, it indicates growth. If it's shorter, it may signal a decline in performance.
Hover your cursor over any point on the graph to see a detailed tooltip. This pop-up will show the exact dollar amounts for that specific timestamp.
Navigation & Customisation
You can control what data is displayed in the graph using the control bar located at the top of the dashboard:
Merchant Facility Filtering
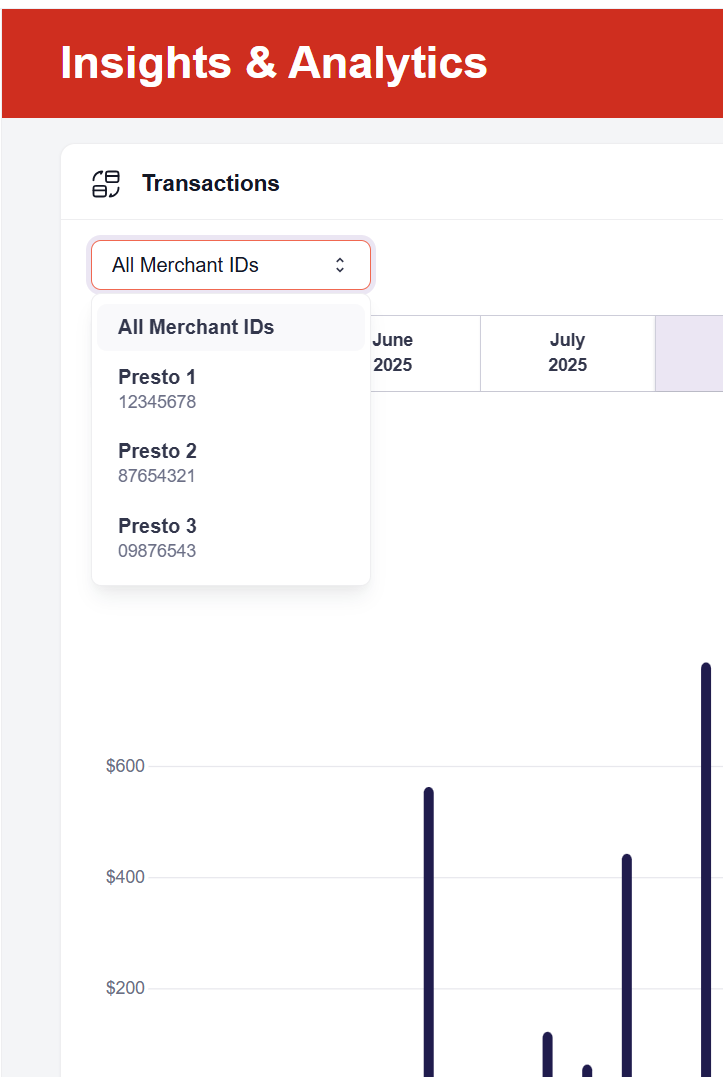
If you manage multiple locations, use the Merchant Facility drop-down to view data for a specific storefront or select All Merchant IDs for an organisation-wide aggregate.
Granularity (View Mode)
Switch between different levels of detail to spot different types of trends:
- Day View: Best for monitoring daily spikes and shift performance.
- Week View: Ideal for spotting mid-week versus weekend patterns.
- Month View: Perfect for high-level monthly growth and seasonal reporting.
Date Range Selection
You can look back at historical data for up to two years. This allows you to perform year-over-year comparisons.
Updated about 5 hours ago